. Introduction
The 3D city models are of crucial importance for the realization of city projects dealing with the third spatial dimension (elevation), for example, urban and spatial planning, environmental simulations or disaster management. Semantic 3D city models offer a reliable and increasingly available virtual representation of real world objects in an urban context (Willenborg et al., 2018). A comprehensive overview of applications of 3D city models is given by Biljecki et al. (2015).
The most important international standard that is used to model cities and landscapes in 3D is CityGML (Ohori et al., 2018). The CityGML standard is an application independent information model and exchange format for 3D geospatial data about objects like buildings or digital terrain model (DTM). From the geometry perspective, there are five standardized levels of details (LOD) in CityGML (Gröger et al., 2012). Figure 1 presents these five possible LOD.
The large cities are starting to provide their 3D geospatial data (often for free) and also in the CityGML format like Berlin1 or Helsinki2. Some cities are offering their 3D geospatial data but not in CityGML data format. Therefore, there is a need for research on how to receive CityGML-based 3D city model from other data formats, both open and proprietary ones. Saran et al. (2018) introduced a flowchart for the transformation of 3D geospatial data in Collada3 open data format into CityGML LOD3. Kolbe et al. (2015) described a creation of 3D city model for New York City (NYC) using datasets, which were freely available in NYC open data portal. These spatial datasets had only 2D geometries, except for DTM (2.5D). Floros and Dimopoulou (2016) presented the transformation of 3D geospatial data created in Google SketchUp modelling tool into CityGML
LOD2 and LOD3.
The aim of the paper is to describe a transformation of the 3D geospatial data of Prague from the proprietary format (in particular, from the widely used ESRI 3D shapefile) into the CityGML, an open data model and XML-based format for the storage and exchange of virtual 3D city models. This will allow for the wider use of the 3D city model by different groups of users and also the other cities, which are going to make their 3D geospatial data available, could benefit from the findings described in the paper. Beside the data transformation, the appropriate database storage and web visualization are described.
The rest of the paper is structured as follows: Section 2 describes the input 3D geospatial data, which were available in the 3D shapefile proprietary data format. Section 3 presents the proposed transformation process using the FME tool. The validation of created CityGML data and their import into the spatial database are described in Section 4. Section 5 presents the visualization of data in the 3D web map client. It is also shown, in which way the attributes from the external data sources can be connected to the 3D data. The conclusions are stated in Section 6.
. The source data
All the source 3D geospatial data were downloaded from Prague’s geoportal.4 The used 3D data were created by Prague Institute of Planning and Development, which is the body in charge of developing the concept behind the Prague’s architecture, urbanism, development and formation. 3D data are available for the whole area of Prague.It should be noted, that Prague is currently the only city in the Czech Republic providing the 3D geospatial data in such extent for free. For testing purposes, only a subpart (the rectangle 2.5 ⨯ 2 km covering the city centre including, for example, Prague Castle or Charles Bridge) was used. The intention was to describe the principles of data transformation, storage and visualization, which can be later applied on larger data sets. In particular, the following objects were available:
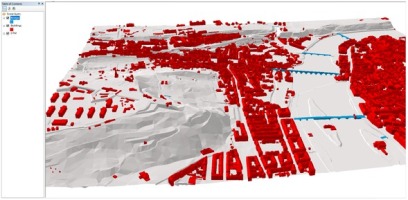
Figure 2 shows the downloaded input data visualized in Esri ArcScene desktop application. The used coordinate systems are S-JTSK/Krovak East North (EPSG:5514) and Baltic 1957 height (EPSG:8357). The 3D geospatial data were further available in proprietary formats dgn and dwg.
. Data transformation
For data transformation, the FME software was selected as it enables the reading of input shapefiles and writing the results into the CityGML data format (gml files). The source data contained no semantic information (e.g., wall surface/roof surface), only the features’ geometries were available. As stated by Biljecki et al. (2016), CityGML is flexible and it does not mandate semantics, for example, an LOD2 with only valid geometry and no semantic differentiation is valid. The transformation is aimed to receive the valid gml files (in terms of CityGML syntax).
Buildings
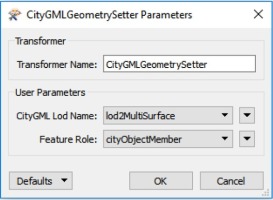
The building model of CityGML is defined by the thematic extension module Building (Gröger et al., 2012). The geometries of buildings in the input file correspond to the LOD2. According to the CityGML standard, in LOD2, the exterior shell of a building can be composed of semantic objects. However, the input data do not contain such semantic information, and therefore, the exterior shell of the building must be explicitly defined, in this case as gml:MultiSurface geometry. FME geometries in CityGML features types that must be tagged with their intended geometry role in order to be written out correctly. The FME CityGMLGeometrySetter transformer provides a convenient way to set both the CityGML LOD name and feature role from a pre-set list of options (see Figure 3).
Figure 3
The setting of CityGML LOD name and feature role. According to this particular setting, the geometry of each building is represented in an output file as gml:MultiSurface at LOD2.
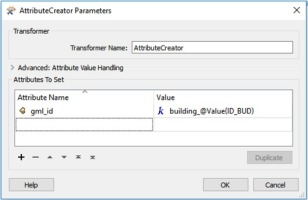
CityGML is an application schema for the Geography Markup Language (GML), and therefore, every feature (like a building or a bridge) is identified by the gml: id attribute. It is of XML type ID, so is constrained to be unique in the XML document within which it occurs. To generate the gml:id attribute the FME AttributeCreator transformer was used (see Figure 4).
Figure 4
Generating gml:id attribute for buildings. The final value of gml:id attribute is based on the feature’s identifier contained in the source 3D shapefile (in this case ID_BUD attribute).
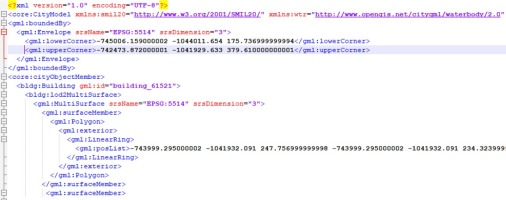
The final transformation schema for the buildings is shown in Figure 5. Figure 6 then depicts a part of the generated CityGML file for the buildings.
Figure 5
The transformation schema for buildings. After the input data are loaded into the memory, the LOD name and feature role are set. In the next step, the gml:id is generated. The conversion ends with writing CityGML into the output file.

Figure 6
Generated CityGML file for buildings. The file contains a spatial envelope (gml:Envelope), for which, extent is given by the coordinates expressed in requested coordinate reference system (in this case, with EPSG code 5514). The buildings are represented as multisurfaces at LOD2 (bldg:lod2MultiSurface).
Bridges
The bridge model of CityGML is defined by the thematic extension module Bridge (Gröger et al., 2012). From the LOD perspective, the bridges in the input 3D shapefile correspond to the
LOD2. The thematic boundary surfaces of a bridge are defined in analogy to the building module. Also, in case of the bridges, no semantic information was available in the input file, and so, the exterior shell of the bridge must be explicitly defined (here as gml:MultiSurface geometry). Also, for each bridge, the attribute gml: id is generated based on the bridges’ identifiers in the source 3D shapefile. The whole schema for transformation of bridges into CityGML (version 2.0) is captured in Figure 7.
Figure 7
The transformation schema for bridges. First, the input data are loaded into the memory, then the LOD name and feature role are set. In the third step, the gml:id is generated. The conversion of bridges ends with writing CityGML into the output file.

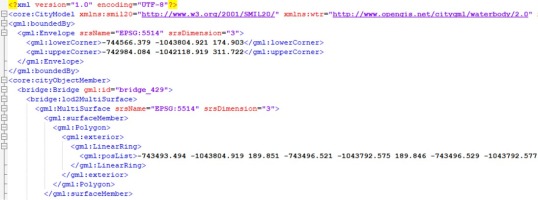
After the conversion is successfully finished, the corresponding CityGML file is generated. A piece of generated CityGML file for bridges is shown in Figure 8.
Digital Terrain Model
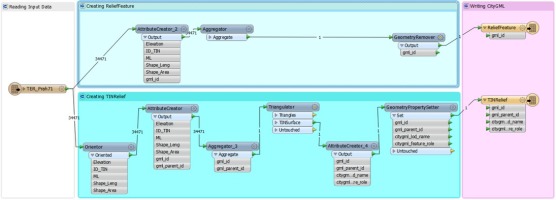
The digital terrain model (DTM) of CityGML is provided by the thematic extension module Relief (Gröger et al., 2012). As stated in the CityGML standard, the terrain is represented by the class ReliefFeature (in LOD 0–4), which consists of one or more entities of the class ReliefComponent. The terrain may be specified as a regular raster or grid, as a TIN, by break lines or by mass points. Due to the fact, that the input digital terrain model was provided as a 3D triangle mesh, it was decided to represent the terrain as the TIN (class TINRelief as a specialization of the class ReliefComponent) at LOD2. The transformation schema for the digital terrain model consists of two parts. The first creates a parent element ReliefFeature, the latter the child element TINRelief.
To create and write the parent element ReliefFeature, its gml: id (using the AttributeCreator transformer) was generated. Then, all the geometries from the input mesh were aggregated by gml: id. Before the element ReliefFeature was written into the output gml file, the GeometryRemover transformer had been used. It completely removed the geometry of the ReliefFeature.
On the beginning of the second branch, the input mesh is oriented (counter-clockwise direction) using the Orientor transformer. This is done to ensure that the elements of the mesh are visible from above the relief. As the class ReliefFeature consists of one or more entities of the class ReliefComponent, it is necessary to capture this aggregation during the transformation. In FME, this relationship can be specified through the gml_id and gml_parent_id attributes. The value of the gml_parent_id of the child element (ReliefComponent) should be equal to the value of the gml_id of its parent element (ReliefFeature). For setting of these two elements, the FME AttributeCreator transformer is used (see Figure 9).
Figure 9
Generating gml:id attribute for TINRelief features. The value ‘ReliefPrague’ of the attribute gml_parent_id corresponds to the gml:id of the parent feature (an instance of the class ReliefFeature).
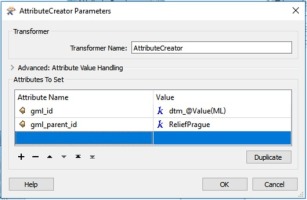
The next step was to aggregate all the geometries from the input mesh into instances of TINRelief. This was done using the Aggregator transformer. The geometries were aggregated by gml_id_parent and gml_id. Furthermore, to receive the right type of output geometry, the aggregated geometries were triangularized using the Triangulator transformer.
The geometry role is specified through the geometry trait citygml_lod_name. Due to the fact that FME CityGMLGeometry-Setter did not support TIN geometry, the AttributeCreator was used again. It enabled to set citygml_lod_name as an attribute, and then to transform it into a trait using the GeometryPropertySetter transformer (see Figure 10).
Figure 10
Creation of the citygml_lod_name attribute (top) and its transformation into a trait (bottom)
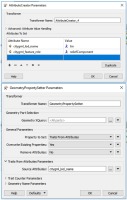
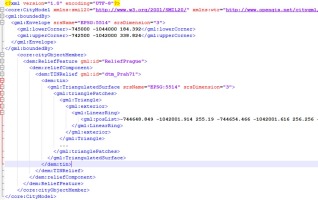
The whole transformation schema for the digital terrain model is shown in the Figure 11. Figure 12 depicts a part of the generated CityGML file for the DTM.
. CityGML data validation and database storage
The generated CityGML files were validated in terms of CityGML syntax and also the validity of 3D primitives was explored. These tests are especially important in case that one wants not only to visualize the data, but also to run some spatial analysis (e.g., noise pollution assessment).
To check the syntax, that is, to ensure that the read data are conformant to the OGC standard CityGML 2.0, the tool 3D City Database Importer/Exporter (Yao et al., 2018) was used. This is a Java-based front-end for the 3D City Database and allows for high-performance loading and extracting 3D city model data. All the CityGML files were validated with the result of zero syntax errors.
CityGML uses GML representation of 3D geometries, which are based on ISO 19107 model (ISO/TC 211, 2003). Therefore, for geometric validation of the tool val3dity (Ledoux, 2018) was used. It is an open source software to validate 3D primitives according to the international definitions of ISO 19107. The 3D primitives must be ‘watertight’, have no intersections, their surfaces are planar and so on. In the generated CityGML files, the volumes are represented with gml:MultiSurface, that is, a set of surfaces embedded in 3D, which should form a volume. The val3dity tool took the CityGML file as an input, processed city objects (in this case, buildings and bridges), validated the 3D primitives and outputted a report that helped to identify the errors. Figure 13 contains the information about the geometric validation for CityGML bridges.
Figure 13
The geometric validation for CityGML bridges using the val3dity tool. The summary states that all bridges are geometrically valid.
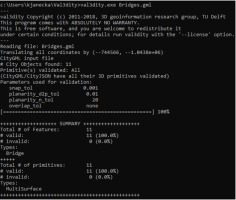
For the CityGML buildings, the val3dity tool reported more than 85% of valid features. In the rest, several kinds of geometrical errors were found (i.e., RING_SELF_INTERSECTION). Even if some tools for automatic reparation exist (e.g., CityDoctor5), due to the complex cases and lack of thematic information, it is appropriate to repair the invalid geometries manually.
To efficiently manage and query the geospatial data, it is sufficient to store them into the spatial database. For storing the CityGML data, the 3D City Database (Yao et al., 2018) was used. It allows virtual 3D city models to be managed on top of a standard spatial relational database. The PostgreSQL with PostGIS option was used.
The 3D City Database’s database schema implements the CityGML standard and supports all the thematic modules from CityGML 2.0 and five different LODs. The created CityGML files were successfully imported into the spatial database using the tool 3D City Database Importer/Exporter.
. Visualization in web map client
The visualization in the web environment enables to disseminate the data to the wider audience. The 3D City Database Importer/Exporter enables to export the stored CityGML data into several data formats suitable for 3D web visualization (KML/KMZ, COLLADA, glTF). As previously mentioned, the used geospatial datasets contain neither semantic information nor the textures. Therefore, the data were exported into the KML and KMZ data formats. Tests have shown shorter loading times (in Google Earth) for the KML format (as opposed to KMZ) when loading from the local hard disk. The Earth Browser’s stability also seems to improve when using the uncompressed format. On the other hand, when loading files from a server, KMZ reduces the amount of requests considerably, thus increasing performance (Kolbe et al., 2018).
Together with the fully detailed geometry information also,
the thematic surfaces were exported. This was due to the reason, that the exporting tool follows a logic, that surfaces touching the ground (having lowest z-coordinate) were considered as wall surfaces and all other were considered as roof surfaces.
For the 3D web visualization of the exported CityGML data, the 3DCityDB-Web-Map-Client was used. The 3DCityDB-Web-Map-Client is 3DCityDB’s front-end for web-based 3D visualization and interactive exploration of arbitrarily large semantic 3D city models (Yao et al., 2018). It has been developed based on the Cesium Virtual Globe6, which is an open source JavaScript library.
As the amount of 3D data to be visualized can be huge, the 3D City Database Importer/Exporter tool enables a ‘tiling’ option. It means that the area enclosed by the bounding box will be exported in tiles and then only the tiles in the vicinity of the viewer’s location are loaded. The tiles can be created manually or automatically. The latter option was used, the side length for automatic tiling was set 125.0 meters. Given the size of the testing area, 17 ⨯ 21 tiles were generated.
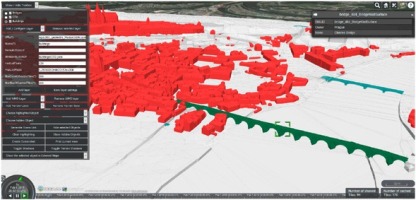
To test the functionality of the 3D web client on a local machine, the 3D web client offers a lightweight JavaScript-based HTTP server (Kolbe et al., 2018). The server was run on the local machine with configuration Intel® Core™ i5-82500 CPU @ 1.60 GHz, 16 GB RAM, Windows 10 64 bit, Intel HD Graphics 620. Figure 14 shows the exported 3D geospatial data after their loading into the web map client.
Figure 14
The 3D geospatial data covering the Prague city centre visualized in the 3DCityDB-Web-Map-Client
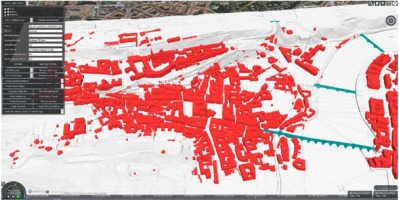
The used 3DCityDB-Web-Map-Client enables to attach the additional attribute information to the displayed 3D geospatial data using their gml:id from an external data source. In particular, the Fusion Tables, which is a web service provided by Google for data management, was used with aim to display the information about the owner of the selected 3D object. The fusion table containing the information about the owners was created manually; however, it could be also fulfilled automatically from the appropriate information system. Figure 15 displays the information about owner of the selected 3D object; in this case, it was Charles Bridge. The proposed solution could be used, for example, for building the 3D cadastre (Janečka, 2018).
. Conclusions
The 3D geoinformation is becoming important for cities and their policies. Incorporating 3D geospatial data into spatial analysis leads, in many cases, to more efficient decisions. The cities are therefore investing resources to obtain the 3D virtual city models. To maximize the economic benefit of such data, the cities provide their 3D geospatial data for further usage, and so, new applications can be created.
The paper explored how could such freely available 3D geospatial data be used for the creation of 3D city model consisting of selected 3D objects (buildings, bridges, terrain). The transformation from the proprietary 3D shapefile format into the CityGML standard was described in detail. Table 1 gives a comparison between the size of input files (3D shapefiles), generated CityGML files (gml) and exported KML/KMZ files used for 3D visualization in the web environment. It was expected that the XML based data formats (CityGML, KML) will be larger than the input 3D shapefile. To increase the performance of the 3D web visualization, the KMZ file format could be used to decrease the amount of loaded data.
Table 1
The comparison of the size of files
| Theme | Input 3D shapefile | CityGML (gml) | KML/KMZ (inc. tiles) |
|---|---|---|---|
| Bridges | 0.5 MB | 1 MB | 27.6 MB/1.5 MB |
| Buildings | 36 MB | 80.5 MB | 166.6 MB/13.1 MB |
| Relief | 19 MB | 9 MB | 13 MB/0.7 MB |
The generated CityGML files were imported into the spatial database with appropriate database CityGML-based scheme. It enables more efficient management and querying of CityGML data. The applications working the 3D city model generally require more semantic information than the input 3D shapefile contained. For example, the buildings could be structured
according to the type of surface (e.g., roof surface). The enrichment of the generated CityGML files for this semantic information is the subject of further research, as well as an automatic reparation of invalid geometries. The type of surfaces, that is, ground surfaces or wall surfaces, could be distinguished based on numeric calculations. For example, it can be supposed that the ground surfaces consist of the vertices with the smallest value of Z-coordinate. The surfaces can be divided into the line segments and then the segments containing the smallest value of Z-coordinate will form the ground surface. An important issue in 3D city modelling is the integration of 3D objects and the terrain; another issue that should be explored is the Terrain Intersection Curve (TIC) as described in the CityGML standard. These curves denote the exact position, where the terrain touches the 3D object, for example, a building or a bridge.


