. Introduction
It is quite often necessary to check mutual displacements of building elements or whole structures. It concerns not only dilatation areas but also places where there are cracks in building structures. In both cases, construction specialists assessing the technical state and safety of a given object require precise and reliable measurement data on changes that have taken place in time. To this end, different measurement methods and technologies that allow assessing the mutual movement between construction elements of an object under study are used (Łakomy, 2018).
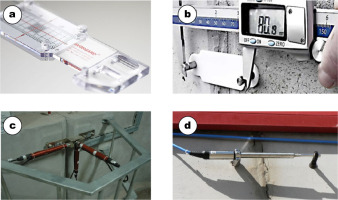
In most cases, the measurement used is that of changes in distance between chosen checkpoints, performed by different techniques. There are analogue, electric, optoelectronic or optic techniques (Fig. 1).
Figure 1
Different measurement solutions: (a) simple ‘crackmeter’ (source: www.avongard.com), (b) measurement solution of SHM-X company (source: www.shmsystem.pl), (c) electronic extensometers in a 3D measurement system and (d) SisGeo linear extensometer (source: www.sisgeo.com).

In practice, many solutions are allowing to determine the size of changes in 1D, 2D or 3D space, depending on the situation (Łakomy, 2018; Germaniuk, 2007). Depending on the measurement technique of distance, we can obtain the results with an accuracy of ±1 mm to several micrometers.
Each of these techniques has significant limitations in terms of measurement quality and spatial interpretation of obtained results. The efficiency of these techniques concerns only and exclusively changes in the length of a section, which cannot always be unequivocally interpreted.
In general, relative movement is very complex, whereas the displacement components that are measured or calculated are not unequivocally identified in space. In consequence, there are a number of simplifications resulting from the conditions and limitations of instruments used and possibilities of their application.
Very debatable is the direction of a joint aperture. Many specialists proposed the measurement in the direction perpendicular to the aperture. The reality is much more complex, and both the measurement and final determination of displacements should be interpreted unequivocally.
In recent years, some novel solutions for crack monitoring were proposed, which use computer vision and image processing techniques (Jahanshahi et al., 2013; Nishiyama et al., 2015; Valença et al., 2013). These solutions can use specialised markers (Germanese et al., 2018; Nishiyama et al., 2015) or perform 3D scene reconstruction in order to detect and evaluate cracks (Jahanshahi et al., 2013).
. Concept of MarQR measurement system
The system is based on a photogrammetric analysis of space re-section obtained from one or many photos of two or more code markers (e.g. QR code), stabilised on construction elements under study. It allows to finally determine the spatial relations between markers, which represent the areas under study. Each of the markers possesses coded information about its original identity and geometric dimensions. These data make it possible to fully automate the measurement process and subsequent stages of data processing. The role of an operator is to take appropriate photographs, based on which mutual spatial relationship existing between markers will be calculated.
The innovative method proposed by the authors is capable of determining correctly interpreted parameters of mutual displacements between two objects with regard to translation and allows to obtain the information concerning three angles of mutual rotation. In general, six parameters are determined in a way that does not raise any interpretation doubts. In addition, exceptionally high accuracy is obtained and there is no limitation as to the range of determined changes.
The solution is most objective and infallible because the ‘observer’ does not take any ‘reading or measurement’, or even names the survey point. His or her activity is solely limited to taking a series of pictures in subsequent observation cycles during the monitoring process. Pictures can be taken with any camera, including smartphone camera. The program in this technology can determine the parameters of spatial displacements and record them in an appropriate file of data-base without any involvement of a log keeping.
. Basic elements of the solution process
The technique of problem solving is presented in a block diagram (Fig. 2). To enable the application of digital pictures, it is necessary to determine the parameters of the camera’s internal orientation. It is a calibration process, the aim of which is to ensure the proper geometric conditions of pictures for their further processing. The images obtained with a digital camera are then processed concerning marker detection and, later, parameters determining camera’s external orientation. After a complex analysis of all constituent elements of such digital processing, the parameters of mutual marker positions are determined.
The concept of how to solve the problem under study required performing an appropriate experiment and applying procedures processing realistic measurement data. To that end, appropriate equipment was chosen and an object fulfilling the system requirements.
Measurement tools applied for the experiments
The pictures were taken using a digital camera Canon EOS R with a lens Canon 100 mm 1:2.8 L IS USM. The focusing distance was determined and unchanged throughout the calibration process as well as measurement exposure. The value of aperture was set for 32 to obtain the maximum depth of field possible and thus ensure the flexibility in choosing the camera distance to markers. The sensitivity of the camera matrix was set for the value of ISO 1000, which was to ensure good exposure conditions with an acceptable noise level at image recording. To ensure uniform lighting conditions from different camera stations, all pictures were taken with a flashgun Stroboss 60c.
Camera calibration
Camera calibration in our case was performed with the help of a pattern consisting of regularly placed dots 18 mm in diameter and spaced out 25 mm from each other (Fig. 3). The pattern was printed on an A1 size foil and stuck on a glass sheet. To calculate calibration parameters, 20 pictures of the pattern taken from different camera stations were used.
Calibration points were the ‘centres’ of visible dots. For the sake of process accuracy, perspective distortion of the aforesaid ‘dots’ image, usually present in such cases, was taken into account.
For the sake of calibration of images (pictures) geometry, a model of lens distortion was used, which takes into account its radial and tangential distortions. For each pixel (u, v) of an image with a removed distortion, the function calculates the coordinates in the original image (x, y). The process is used as follows:
whereRadial and tangential distortion is removed according to equations:
Calibration calculations for individual sets of calibration pictures were made with the use of OpenCV procedure library (OpenCV, 2018). Corrected pictures were compared with their original images and residual error was determined. The average re-projection error of points on the original image did not exceed 0.5 of the pixel size (Fig. 4). Such calibration procedures allow to correct recorded images and continue their further processing in accordance with the photogrammetric procedures.
Picture of the QR code sign as a most suitable marker model
QR codes were adopted as markers to be used in the MarQR system, because of their suitability for multipoint raster analysis. Their key advantages are distinctive high-contrast geometrical features that are crucial for precise markers detection, combined with the ability to carry arbitrary information (Figure 5). This allowed markers to be self-identifiable by containing its name (number) and size encoded in its shape. This makes them perfect for automated and reader-independent monitoring systems. QR codes were generated and decoded with the use of ZBar library (Brown, 2011).
Figure 5
QR codes with coded text information: (a) ‘MQR: N:00001 S:50.00’ (marker number: 00001; size: 50.00 mm × 50.00 mm) and (b) ‘MQR: N:00002 S:50.00’ (marker number: 00002; size: 50.00 mm × 50.00 mm).

For the sake of tests concerning the results repeatability and system operational accuracy, the markers were printed on adhesive paper and stuck on a glass sheet to ensure their flatness.
Calculation process
As a result of the photogrammetric analysis of a picture set of QR code markers, their spatial interrelationships are set down. It is a two-stage process illustrated by the diagram in Figure 2. The first stage is processing individual pictures. It consists of appointing internal orientation elements of the camera and correction of lens distortion, finding the QR markers photographed on a picture and setting down the precise 2D position of markers’ apexes on an image. The second stage is determining the relation between markers based on two or more pictures. It consists of verifying the compliance of markers present in the pictures, setting down external orientation elements and optimising the mutual position of markers. The assumption was that the marker with lowest number was recognised as a reference one, and all markers’ relations are expressed in its coordinate system.
By applying the calculation algorithm, we obtain the values of translation and rotation parameters (6 degrees of freedom) of the measurement marker in relation to the referential one.
Initial processing of a single picture and marker detection
In the picture with a removed distortion, there are set down positions of QR markers. The procedure library ZBar automatically discovers markers on a given picture, decodes their textual content and shows their approximate position. Knowing the information coded in the marker, we can build its theoretical model. Owing to error correction built in the QR Code technology, the proposed algorithm of solving the problem is resistant to minor dirt or damage of the marker’s image.
In order to set down the precise position of the marker on a picture, an iterative algorithm is followed, concerning the adjustment of QR code’s image to a theoretical one by applying perspective transformation. The quality of adjustment is defined based on the normalised information shared by both NMI (Normalized Mutual Information) images (Figure 6) (Strehl and Ghosh, 2003):
where I(X, Y) is the mutual information concerning random variables X and Y defined as: where p(x, y) is the mutual probability distribution of X and Y and the values p(x) and p(y) are, respectively, the occurrence probabilities in X and Y. Variables distribution H(X) and H(Y) are the entropy values of variables X and Y, respectively:The coordinates of the marker’s four apexes were optimised parameters used in the present study. Applied optimisation was based on a nonlinear method of conjugate gradients. It consists of solving a nonlinear unconstrained problem (Hestenes and Stiefel, 1952) in which the vector value of optimised attributes xk in subsequent iterations is determined from the dependence:
where the step value αk is determined by seeking an optimal position in direction dk. Direction dk is determined based on the dependence where βk is the updating parameter of the conjugate gradient method and gk = ∇f(xk)T is the gradient ∇f(xk) of function f in xk, where xk is the row vector and gk is the column vector.Various conjugate gradient methods have different values of scalar βk (Hager and Zhang, 2006). The value of parameter βk was determined in accordance with Hestens and Siefel’s original study (Hestenes and Stiefel, 1952):
whereTo ensure optimisation stability, the process was carried out for many resolution levels of marker reconstruction, starting from the picture of 108 pixels × 108 pixels up to 540 pixels × 540 pixels. In this way, we managed to avoid local minimums, which potentially falsify the result of image adjustment. By applying the algorithm of the theoretical adjustment of the marker’s image to its photo, we obtain precise position of the markers’ vertices. On the basis of their positions and camera parameters determined during the calibration process, we can set down the position of the camera concerning the marker. In other words, it denotes determining the elements of external camera orientation. However, it should be noted that, in many cases, geometric conditions and a small marker size may lead to significant errors in determining the position of markers in 3D space. Applying several photos taken from different locations allows removing this defect effectively.
Fusion of many photos and precise determination of mutual markers positions
Owing to the application of many photos, it is possible to improve the accuracy significantly in determining mutual markers positions. The proposed concept is not limited by the number of photos based on which transformation parameters are determined. The smallest number of photos suggested by the authors is two (stereogram).
In the presented analysis, we concentrated on the case of two convergent photos. Such pictures allow designating both the position of projection centres of individual pictures and coordinates of the principal points of QR code images. The task of optimisation was carried out by the conjugate gradient method according to Hestenes and Siefel. The optimised vector of attributes included the position of the camera concerning the referential marker for each of the pictures and the relation between the referential and the measurement marker, which remains the same for each of the pictures. As a quality parameter of image adjustment, an average square error of apexes position determined in the picture in relation to markers’ projected position was adopted, which was carried out based on the adjustment:
where k is the number of the marker’s vertices and j is the picture number.It should be noted that the position of the referential marker in relation to the camera is influenced by the adjustment of all visible markers. It means that it is possible to increase the precision of determining its position by increasing the number of markers in the picture, which has been experimentally analysed by the authors of the present study.
. Measurement of markers interrelationship on a flat surface
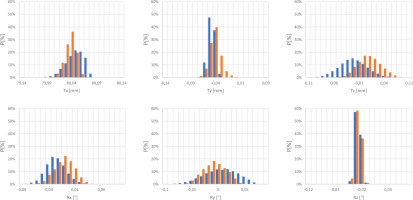
Measurement across joints is most frequently made on a specified plane. To study this case we carried out the test of a system of two markers (Case A). The first of these is a referential marker and the second – a measurement marker. In addition, we carried out a test with an extra QR marker, which should ensure better position establishment of the referential marker (Case B). The situation in both cases is illustrated in Figure 7.
Our test shows very high accuracy in determining the interrelationships between markers (Figure 8). The obtained values of standard deviation for translation parameters are below 0.03 mm (Table 1). The application of an additional marker in Case B made it possible to lower the value of standard deviation for designated parameters (Table 2).
Figure 8
Distribution of a probability density function concerning determined mutual position values of markers, based on photos taken for Case A (blue) and Case B (orange)

. Measurement of markers’ interrelationship in a corner configuration
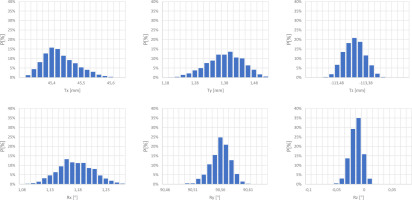
In special cases, when the crack is directly at the corner of the structure, installation of a crack-meter must be made in a corner configuration. Because of great stabilisation freedom of system markers, the MarQR system ideally proves its suitability in such nonstandard situations. To demonstrate the system’s potential, we decided to present the case when markers were placed on the corner (Case C). Owing to specific geometric conditions, in such a case, it is optimal to take photos along the edge (see Figure 11).
For this particular situation, a series of photos were taken, based on which 160 independent translation and rotation parameters were determined.
It is worth noting that the repeatability in determining the distances between markers (Figure 10) is significantly better than the values of translation Tx, Ty and Tz (Figure 11). This is caused by the error in determining the orientation of the referential marker and can be rectified by applying larger markers or increasing their number. Despite a little worse precision results than in Cases A and B, the last results still fall into the range below ± 0.06 mm (Table 3), which is a perfect practical result.
Figure 9
Distribution of a probability density function concerning the values determined for mutual positions of markers, based on photos taken for Case C

Table 3
Case C (number of photos: 36; number of photo pairs: 160)
. Summary and conclusions
The experiments that have been carried yielded good results concerning the system operation accuracy in determining the parameters of the mutual position of two measurement markers. For Cases A and B (markers installed on a common plane), the standard deviations in determining translation parameters were, on an average, below 0.02 mm, whereas the orientation parameters were in the range of several hundredths of a degree. The accuracy of the above values was confirmed in individual tests for various cases likely to be used in displacement measurements. Compliance has also been confirmed in determining internal displacement parameters and thus the good performance of the measurement system.
The proposed MarQR technology enables remotely and objectively, to determine both the elements of mutual spatial translation and orientation changes in 3D space. At the same time, it is a method that allows making such determinations without any constraints relating to installation conditions and the scope of changes.
These features make MarQR system suitable to substitute extensometer measurements in conditions where installation of them is difficult or full 3D displacement information is needed.


