
. Introduction
Highways are capital-intensive structures, so their planning should be aimed at the one hand at achieving high performance and on the other to minimise construction costs. Today, it is problematic to work with linearly extended objects without the involvement of CAD or geographic information system (GIS) technologies. At different stages of the life cycle of roads, separate information systems are used, but usually in combination with the already mentioned ones.
In recent years, artificial intelligence has become increasingly common among the many methods used to solve combinatorial optimisation problems. Multiagent optimisation methods are an innovative direction in the development of artificial intelligence. They model the collective intelligence of animals, insects and other living beings and are known as Swarm Intelligence methods.
The classical theory of artificial intelligence requires one intellectual system that contains all the necessary resources. In multiagent systems, the reverse principle is used.
Among all the currently available methods of multiagent optimisation, bee, swarm and ant methods, the ant method is the most effective for solving the problem of optimising the planning of traffic network flows. Under equal conditions, its efficiency is the closest to optimal. From a practical point of view, this allows us to simulate the appearance of a bridge or other additional roads or obstacles. For example, simulate washouts of the roadway or other additional unfavourable objects and obtain information on the adaptation of agents to the circumstances.
The study aims to increase the efficiency of road transport networks based on the method of ant optimisation.
. Analysis of previous research
Notable for the study were the scientific works of Hulianytskyi (2017), Kuzmin and Lotysh (2012), Muliarevych (2016), Subbotin et al. (2009), Khazin (2012) and Shtovba (2004), who highlighted the current trends and methods of solving transport and logistics problems, and the works of Burshtynska (2001), Lyashchenko (2002) and others, who analysed the methods and models for digital terrain modelling, in particular.
Ant methods were proposed in the early 1990s. The first article on ant methods was published in 1996 in an international scientific journal. It was authored by Professor Marco Dorigo (Dorigo and Stützle, 2010). Since then, they have found and still find various areas of practical application.
Urban development and improving the quality of life of the population cause an increase in motorisation and require optimisation of urban transport systems. The use of traditional methods becomes impossible in spontaneous cases. Therefore, the search for models designed to reduce the average duration of passenger travel by reducing the number of transfers began. On the other hand, models should maximise the profits of transport companies by increasing efficiency and reducing the total length of bus routes. The ant method proved to be an effective tool for achieving the set tasks. The results of research work № 4-523/13 conducted according to the geodata of electronic maps of passenger correspondence matrices for the city of Tomsk (Russian Federation) allowed to optimise the density of direct passengers from 25 people/km to 38 people/km (Kochegurova et al., 2014).
Taxi route planning in the Jinjiang area (Chengdu, People’s Republic of China) is beginning to rely on the ant method, which guarantees the optimal route length, method stability and total profit per unit of time (Qiu and Xu, 2018).
The planning of tourist routes is considered as a search for the optimal route, taking into account the entry–exit points of picturesque places, public service points and the road network. Ant methods satisfy the optimal solution of this problem with the minimum number of initial parameters in comparison with the genetic methods (Zhang et al., 2017).
The use of a variety of ant method – dynamic planning of tourist routes based on the adaptive method of optimising the ant colony – shows a reduction in travel time by 32.32% and a reduction in computation time by 25.53% (Yu et al., 2017).
The development of the economy in market conditions is achieved by ensuring competitiveness. It is reasonable to introduce innovative methods and technologies of delivery of goods related to logistics concepts and achievements of technical progress. The conditions of such tasks are formulated by finding the optimal plan of transportation of goods from the points of departure to the points of consumption, which means finding the optimal distances with minimal costs. There are several ways to solve this problem, including the ant method.
The results of calculating the economic effect of implementation of the method of optimizing the transport costs for an enterprise located in Vitebsk (Republic of Belarus) and selling products in different regions of the country are indisputable and visible in the medium and long term by reducing the cost of production (Vardomatskaja et al., 2016).
Multiagent colony optimisation was used to balance the cost of transporting goods and satisfy customers in non-rigid time frames and road conditions (Huang et al., 2018). Customer satisfaction depends on the time of arrival of the car relative to the customer’s expectations. The road network was taken as a static model because in many cases, the cost of transportation between two localities is usually considered as dependent on distance, whereas the dynamic variables – the amount of traffic, the speed of the car, traffic in emergencies and during rush hour – were taken as adaptive agents. Thus, the real change in road conditions at different times affects the speed and changes the total transport cost. The developed multiagent colony optimisation with adaptive pheromone stimulation factor, adaptive pheromone expectation and renewal factor for 40 customers experimentally proved the expediency of its application.
Particular attention should be paid to operational transport modelling, taking into account the redistribution of networks of isolated parts (blocking of individual roads during tree falls, landslides, erosion, earthquakes, etc.) as a result of emergencies. Involvement of a meta-heuristic approach based on optimisation of ant colonies for small networks gives the same results as deterministic methods and in large networks, optimal results are optimised by 38% within 5 minutes of iterations (Vodák et al., 2018).
In this aspect, systems for quantitative assessment of the safety of evacuation routes in real time during emergencies are being developed using the ant method of optimising and GISs. Static data on land use, construction sites and road networks, and dynamic public information of users are taken into account (Yamamoto and Li, 2018).
Modern cars are equipped with the tools necessary for autonomous traffic, and the planning of their routes is carried out using Global Navigation Satellite System (GNSS). Thus, modern vehicles form multiagent systems that can increase traffic efficiency, which in the long run will optimise the capacity of road networks by 20%–25% and abandon traffic lights as a means of traffic control in cities (Shuts, 2014).
Driving unmanned vehicles requires navigating traffic due to dynamically occurring obstacles, which is more complicated in real time, when the sensor system detects moving or still unknown obstacles and the planning system must locally change the route accordingly. Among the many proposed methods, the ant method has parallelism and positive feedback in static and dynamic environments, which makes its use promising in combination with the use of discrete point maps (Chulin and Geng, 2016).
Experiments are underway to involve GIS and ant methods for managing solid waste management. For example, in an area in Kanpur (India), the total length of traffic routes was reduced by 27.78% (Kalamdhad et al., 2016). Almost comparable results were obtained in the region of Attica (suburbs of Athens, Greece) at 25.6% (Karadimas et al., 2007).
For the most part, scheduling tasks involves optimising two or more target functions simultaneously. So, these problems are usually called multi-purpose optimisation. Considering the multi-purpose optimisation methods of route search, there is a need to use improved approaches to optimise ant colonies. Improvements are the ability of the user to select the final route according to the desired priorities. The results demonstrate that the proposed approach is characterised by acceptable parameters, repeatability and execution time (Masoumi et al., 2021).
Most ant methods operate on two-dimensional (2-D) surfaces which does not take into account the influence of the slope of the terrain on the choice of route. However, the method of a parallel ant colony allows planning based on three-dimensional (3-D) landscapes. Rasterisation of maps using the bilinear interpolation method allows the transition from 3-D to 2-D according to a given slope step. The simulation results show the suitability for route planning on 3-D surfaces. Also, with the increasing territory and the use of parallel computing, productivity triples (Zhang et al., 2017).
. Methodology
This study is based on the Max-Min method of the ant system with an additional coefficient to cover the route’s complexity, affected by its length – the functional distance. This modification had an effective influence on the behaviour of ants and the choice of optimal routes, including taking into account the terrain conditions as one of the factors.
In multi-agent systems, tasks are divided between agents, each of whom is considered a member of a group or an organisation. The division of tasks involves assigning roles to all members of the group, determining the degree of their responsibility and experience requirements. In this study, each intelligent agent decided on the appropriateness of using a cell to pass part of a linear object in the form of a future road route. The initial data were geospatial layers of information on slope steepness (a), engineering structures (b), forests (c), perennials (d), land development (e) and hydrographic objects (f).
Slope steepness (a) is a geomorphological parameter calculated based on a first-order derived surface. The main criterion of optimality, as a rule, is the cost of road construction and operation. It depends both on the length of the road and on the passage of sections of the route on certain elements of the terrain. Obstacles are taken into account: built-up areas, natural objects, reservoirs, existing structures, communications and slopes of the terrain with steepness values above the allowable. The set of obstacles is expressed in the form of Digital Surface Model (DSM).
The use of publicly available geospatial data for road routing in comparison with land methods allows to reduce the time and volume of field surveying, increase the productivity of the search process and reduce their cost and reduce the cost of construction by choosing the best options and using more detailed information about the area.
DSMs are obtained by various methods. Among them, in particular, the following can be mentioned: traditional topographical and geodetic surveys, GNSS methods, analogue and digital photogrammetry methods, Light Detection and Ranging (LIDAR) scanning, sonar and radar scanning, application of satellite altimetry and interferometry. Most of these methods are expensive, which hinders their use.
A study by Hutsul and Smirnov (2017) assessed the accuracy of global altitude data for the territory of Chernivtsi oblast and reported the feasibility of using freely available data radar Shuttle Radar Topography Mission (SRTM) survey (with subsequent filtering from vegetation and built-up areas) to obtain a digital terrain model and geomorphological parameter of slope steepness (a).
Engineering structures (b) are a point layer that includes bridges, hydraulic structures and culverts, which allow the formation of passages over hydrographic obstacles. During the classic tracing of the highway, checkpoints are chosen, through which the future route should pass or which should be bypassed. It should be noted that the neglect of the availability of culverts led to the search for an alternative path, even because of a small water barrier, which exceeded the economically justified variant and worsened the quality of the results generated by the ant method by several times. The main data source for this layer was the remote sensing method, according to which the locations of engineering structures are established by visual decoding.
Forests (c) and perennials (d) contain areas covered with natural forest and shrub vegetation and agricultural land under artificially created woodlands, shrubby or grassy vegetation. Land cover has been taken into account using the Coordination of Information on the Environment (CORINE) methodology, which aims to create and periodically update the ground cover CORINE Land Cover (CLC) database and computer mapping of this data based on photointerpretation of radiometrically and geometrically corrected orthorectified satellite images obtained within the IMAGE project. The CLC database is available online for most regions of Europe for the reporting years 1990, 2000, 2006 and 2012 in the Copernicus Land Monitoring Service networks and contains information on the current condition of plots using a minimum mapping unit of 25 ha, and the threshold for detecting changes in land cover is set in the amount of 5 ha.
The built-up areas (e) include the territory of localities. It is a set of already existing industrial and public buildings and private land areas. Territories of localities determine the need to take into account the composition of lands, their functional use, forms of ownership, restrictions on their rights, etc. Withdrawal of such areas is possible for public needs according to the Land Code of Ukraine (in particular, for placement of linear objects and transport infrastructure – roads, bridges, overpasses and structures necessary for their operation), in addition to the presence of land improvements causes high-cost reimbursement. Besides, a relatively dense road network has already been formed on the territory of localities and measures for its long-term development, taking into account the master plans, have already been developed. The source of data is the geometry of spatial objects of settlements located on the geoportal ‘Administrative-territorial organization of Ukraine’.
The objects of hydrography (f) are represented by a combination of linear objects of the river network and polygonal objects of reservoirs (ponds and lakes) (data source – geoportal of the State Water Resources Agency ‘Water Resources of Ukraine’). In addition to the supplemented and partially corrected geometry data of hydrographic objects, buffer protection zones are also included according to their sizes.
A significant impact on the quality of the route completion is due to the method of landscape visualisation. For this, mainly, the form of a matrix of passages for representation of the map is used. The choice of cell shape plays an important role in the implementation of the method, as it affects the length of the path. Currently, the optimal is a square cell with eight nearest neighbours.
In the study, the map was interpreted as a set of square cells that formed a grid. The centroids of the squares coincided with the regular SRTM altitude data network and contained the attribute characteristics (a, b, c, d, e, f) of each of them at this point and the unique numbering (ID). In turn, the initial attributes of each of the points form a function k(a, b, c, d, e, f) setting the influence of each factor on further passage of the route by the method of ant optimisation. The surface characteristic for indicator (a) covers the range of slope steepness values [1, . . ., 90], while the other factors (b, c, d, e, f) are described by the range [0, 1], where 0 is the complete absence of influence of a sign and 1 is its presence. It means that even the partial presence of an obstacle within a square is taken into account.
In turn, the output attributes of each of the points form a function ki = ai × bi × ci × di × ei × fi specifying the influence of each factor on further passage of the route by the method of ant optimisation according to the list of conditions:
(1)
The values of 20, 70, 500 and 1000 given in Equation (1) are established by performing experimental researches with the condition that the results of ki cells obtained by them will not overlap each other when calculating the complexity of routing.
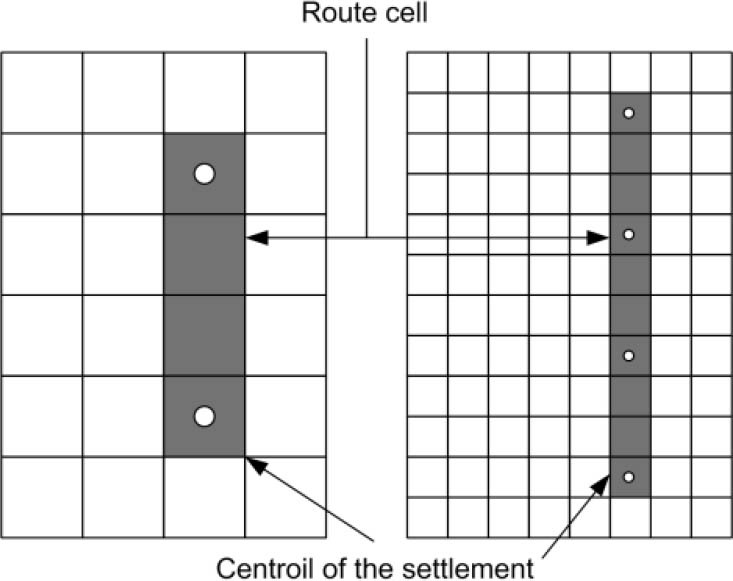
The functional distance (impedance) between the two localities A and B (Figure 1 and Table 1) was calculated using Equation (2):
where:A is the identifier of the initial locality;
B is the identifier of the final locality;
n is the number of route cells between the points A and B;
i = 1, 2, 3, . . ., n is the number of cells;
Δxi is the distance between the points i and i + 1:
ki is the value of the coefficient of complexity of the route composition for the cell.
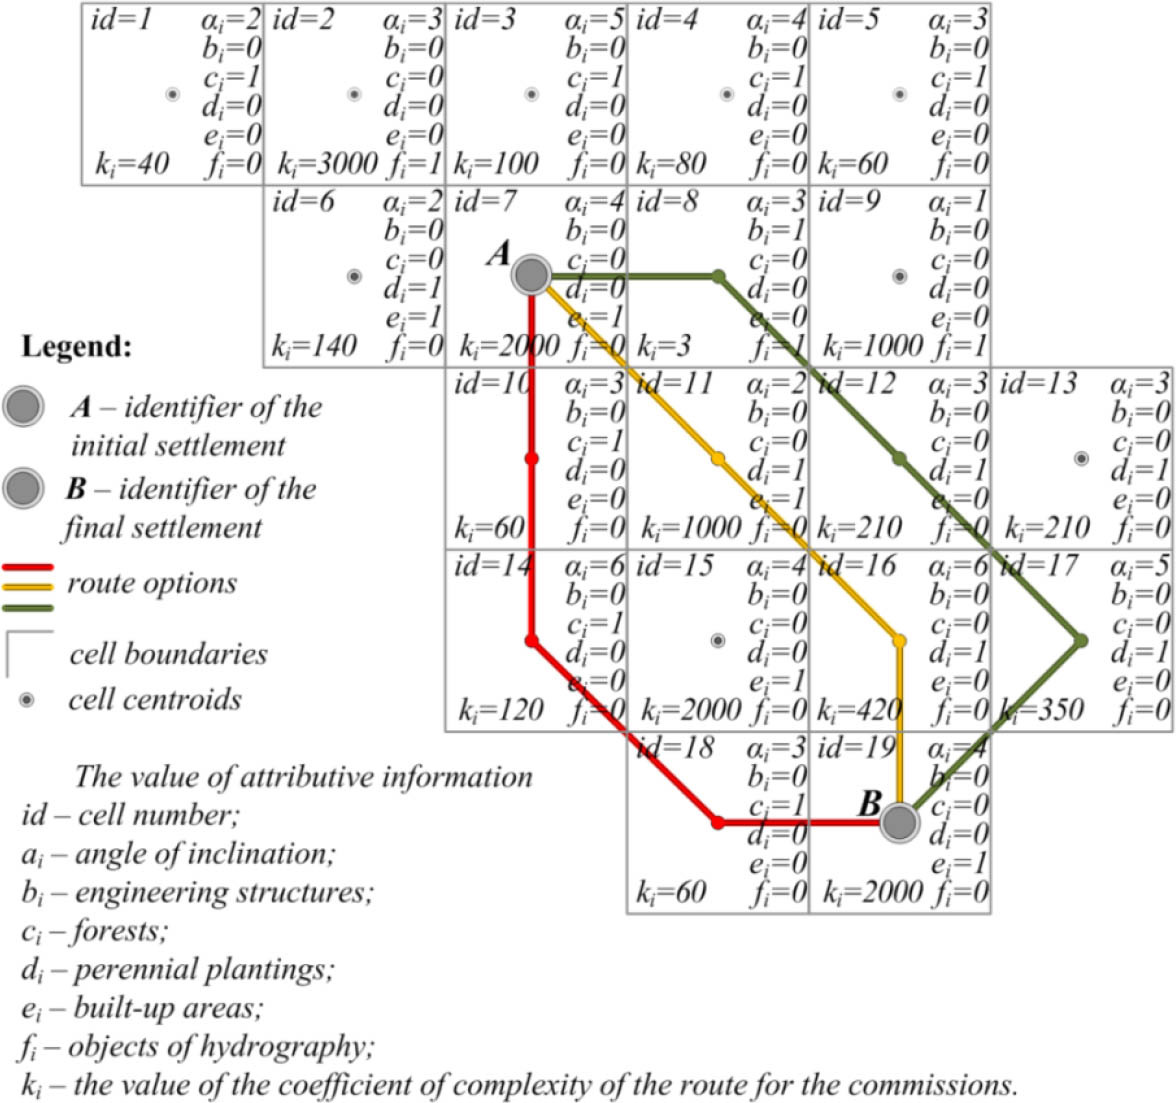
Table 1
Calculation of the coefficient of complexity ki (impedance) of routing
The total distance includes the sum of all distances Δxi that pass between the localities that make up the current route and is described by equation:
where W is the number of the localities on the route.The probability of passing of an ant from the current point to the next is calculated using equation:
where:Pi is the probability of transition in the direction i;
li is the value reciprocal to weight (length) i of the passage;
ri, j is the amount of pheromone on the edge i, j;
q is the value that determines the ‘avarice’ of the method;
p is the value that determines the phasing of the method q + p = 1;
S is the plural of the unvisited nods and
m is an index used for identification of the neighbouring unvisited nodes.
The movement of the ant from node i to node j will be with the probability of:
where:ri, j is the amount of pheromone on the edge i, j;
α is the parameter of influence control ri, j (determines the weight of perception of ‘smell’ by an ant);
μi, j is the appeal of the edges μi, j and
β is the parameter of influence control μi, j (determines the level of pheromones).
The study found that when the value of the parameter α is set close to zero, the probability of finding the nearest cities will increase. If β is set close to zero, then only the propagation of pheromones works, which quickly leads to a situation in which all ants choose the same route, reducing the optimality. Thus, it is proposed to maintain a balance between these parameters and the intensity of pheromone evaporation. Because of this, the values of the parameters of influence α and β were everywhere assumed to be constant: α = 0.5 and β = 0.5.
As a result of the traffic condition, each ant generated a route. The resulting array of routes was sorted by length from min to max taking into account the number of localities W.
According to the method proposed in the study, after generating routes, the pheromones on the most optimal route should be updated:
where:ri, j is the amount of pheromone on the edge i, j;
ρ is the pheromone evaporation rate and
Δri, j is the amount of placed pheromone.
In turn, the amount of placed pheromone Δri, j is calculated using Equation (7):
where Q is a constant related to the amount of pheromone left in the path (Q = 1) and distAB is the functional distance between two localities A and B.The amount of pheromones is limited by the conditions max, min. Pheromones were placed only on the optimal routes detected by repeated application of the mathematical operation. All edges are initiated by the value of max.
When outlining a route, the pheromone matrix for the corresponding movements from any point to the next one will become constant −1. In the process of operation of the method on each iteration, there will be a route with the minimum cost of passage. The value of pheromone will be increased for this route. For the other routes the value of pheromone will be decreased due to evaporation. User specifies evaporation rate before starting the calculation. Although the choice of each subsequent point for the movement of ants is random, the presence of a pheromone on the route of movement from any point to the next increases the likelihood of choosing such a variant of movement. This leads to the fact that the value of the pheromone increases in the most visited points. Thus, the optimal routes are constantly improved, while the evaporation of the pheromone essentially minimises the possibility of selecting certain points, and therefore, as a result, the potential field for finding options for the probable route will decrease.
A study of modifications to the ant system methods has shown that productivity gains can be obtained through more intensive use of the best solutions found in the search process.
The software implementation of the method is performed using the object-oriented programming language Java 8. Eclipse, a freely integrated environment of modular cross-platform applications, has become the development environment. In the process of work on this method were used open libraries: GoogleGuava, ApacheCommonsIO, ApacheCommonsLang, ApacheCommonsCollections, ApacheLog4j; classes Point, Route, Ant, Environment, Path, AntMovingTask, RouteComporator, Update-EnvironmentTask, RouteUtilityFactory, ACO, ACO2. The graphical interface is implemented by involving standard classes – Jpanel, JButton, JTexbox.
The calculation results are available as a *.csv file and contain five columns of information (id – unique record number; x, y – rectangular coordinates on the axes OX and OY; centroid_name – the name of the centroid locality; impedance – movement cost). Graphical derivation of the results consists of the ordinal combination of points according to their coordinates. At the same time, the appearance of self-intersections and lightning-like fractures of false artefacts is possible. The occurrence of topology errors is primarily due to the peculiarities of the search for results. For example, in some cases, adjacent cells contained identical values. During the study, it was found that the graphical simplification of the results is optimal by dividing the polylines into separate segments with the subsequent involvement of the ArcGIS Network Analyst module. Ordinal numbering of centroids of settlements allowed to choose the optimal route option.
Testing of the calculation results was carried out taking into account several parameters necessary for the operation of the modified method: changes in the number of ants, iterations, values of parameters of control of α and β and conditions of the territory allowed to understand the reasons for not detecting all centroids. They lie in:
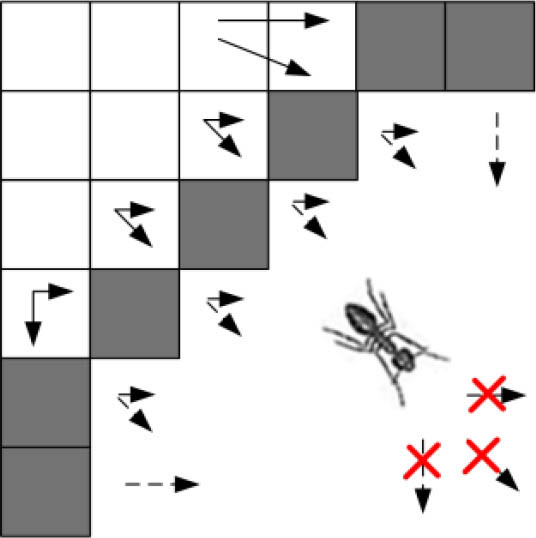
lack of possibility of further movement (ants go beyond the map). When the ant reaches the endpoint located on the border of the map, and further movement is not possible. The point from which it came cannot be visited again, and there are no new points (Figure 2).
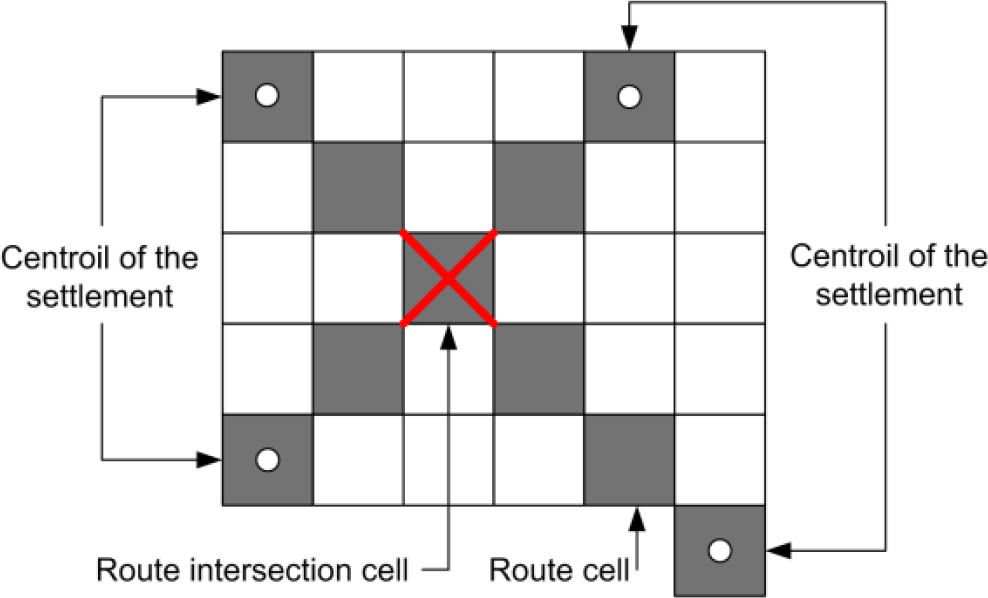
self-crossing of the route. When the routes are combined, the visited cells may intersect, and therefore, such a route will be rejected (Figure 3). Each ant will have a route without self-intersections; but when combined, there is a possibility of sections that are present in another route or duplicate it.
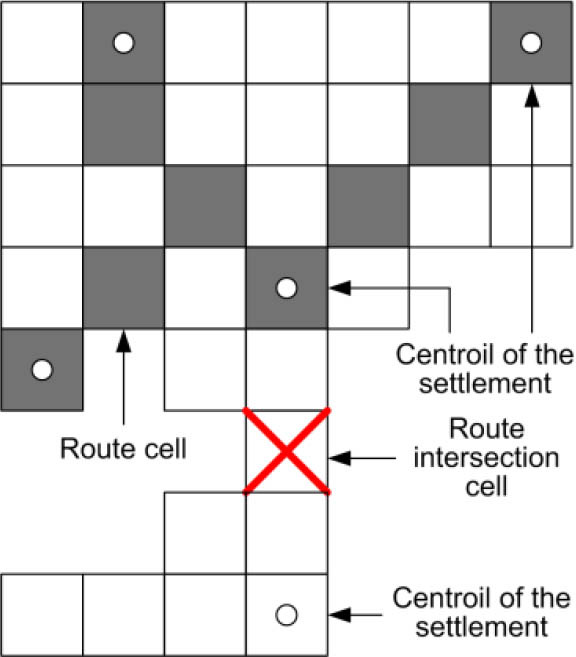
the point can be found but does not belong to the shortest route, and will be ignored. As a rule, such points can be reached only from one locality (Figure 4).
excessive detailing of the territory. Increasing the surface discreteness leads to a conditional increase in the number of cells between the centroids, and therefore reduces the probability of finding them due to the occurrence of the three previous conditions (Figure 5).
an ant’s attempt to return to the already visited point leads to ignoring the entire route.
To form a network of optimal routes with a combination of all given centroids (localities), the combination of the gained results should be followed.
First of all, the method should be implemented immediately for the whole study area. With a significant duration of calculations, it will be possible to find only a certain number of centroids connected by the optimal route. The remaining cells in the territory should be allocated, so that one of the areas should contain several centroids, to which the method has already managed to create the route and export it to a separate *.csv-file. If there are separate centroids that do not belong to the shortest route, the route should be resampled to contain several centroids. The result with created routes should be exported as a *.csv-file.
Given the randomness factor of the ant’s movement, which leads to the formation of a unique network during each iteration, many optimal routes can be created.
Collected routes should be grouped into one vector layer, divided into segments (edges), and nodes are added at the intersection, followed by redivision into segments. Then, from the created layer, generate a set of network data for ArcGISNetwork Analyst. In manual mode, consistently put all the stops at the location of the centroids of settlements. Export the generated route as a *.shp file.
The adjustment of the options for road transport hedges has been established by the way of visualisation of the current and modelled ones in the development of administrative districts in the Chernivtsi region (Hutsul, 2018).
In order to model it, same rule is applied for all the areas: 10,000 ants and 1000 iterations, with the parameters for controlling the injection α = 0.5 and β = 0.5 and the liquidity of the injection of pheromone per annum. Obviously, the meaning of the number of vicarious tributes and the heterogeneity of the natural-state minds of the territories can be attributed not only to the triviality of an hour of iteration, but also to the difference in efficiency.
If routes are not laid in the area between the given centres of settlements due to difficult relief conditions, dense river network or forest cover, we can apply special conditions to model routes for such areas. The results of such modelling can be combined with the measurement of other laid routes due to the fact that they are in the coordinates (geospatial data) and are set from the centres.
At the same time, the search area should be reduced, leaving only the two nearest centroids between which the trace is planned. Note that each of the administrative districts must have connections with neighbouring administrative districts. We implement it by tracing the routes between the nearest adjacent centroids. Thus, we will continue the search for centroids separately for objects that for objective reasons are not detected during the first start of the method.
Although increasing the variants of solutions allows to achieve certain advantages (smoothness of the geometry elements of the direction of the future route), for the sake of objectivity of the experiment, we will limit ourselves to the first positive result obtained. In the context of this study, the method of ant multi-agent optimisation of traffic flow planning should connect all settlements (centroids) of the district into a single network with a minimum distance and on compliance with the current requirements of state building codes.
The calculated values of the lengths of the simulated linear objects within the administrative districts are presented in Table 2.
Table 2
Comparison of road network options
In almost all cases, in Table 2, there is a decrease in the total length of the simulated networks. First of all, this is due to the greater number of points of interest in the existing ones. For example, production facilities outside settlements, places of mining, etc. are located separately. Whereas, during simulation, we are limited to the centroid of the settlement.
. Discussion
The complexity of the calculations significantly affected the parameters and architecture of the developed application. Changing approaches to information processing or attracting new technological solutions give this method development prospects, which are seen in areas as follows:
Adding clustering of localities. By subdividing the sample of centroids into subsets, you can search for optimal routes between the nearest localities and then combine them. The total time spent on the resolution is expected to decrease.
Transition to the graph database of input data. Currently, the area of the terrain described in the form of a grid surface, the input data of which is abstracted in the form of points (centroids) of cells, shows vertices and edges (formed after the connection of points). Such a description will significantly speed up the search time for the nearest (neighbouring) points.
Automatic regulation of parameters α and β depending on search results. The change of the specified parameters should be carried out at hit in local minima when after a long number of iterations, the method does not improve. It is expected that route routes should be formed in the fragments of the surface, where there is a problem of local minima and there is no solution at all.
Development of a mechanism for pausing/starting and exporting intermediate results. Currently, they are stored in memory and available for processing only after all calculations are completed.
Improving the evaluation function of each cell visited and its impact on the overall route.
Changing the shape of the cells of the grid from squares to hexagons (regular hexagons). The main advantage is that the equidistance of all sides forms more reliable data for the abstraction process.
Improve the multithreading of the ant method by switching to specialised libraries to work with BigData (e.g. Akka).
Change the method, so that instead of launching one colony of ants (and accordingly, several ants in each locality), a set of ant colonies (for each locality own) is used, which will work in parallel and exchange the found routes among themselves.
Development of a mechanism for the preliminary analysis of terrain conditions and application of recommended tracing strategies for plain and mountain parts.
. Conclusion
The current level of development of the road transport network of Ukraine does not meet the requirements of increasing the competitiveness of the economy, meeting socio-economic challenges, successful fulfillment of the role transit state and the sale of mineral, forest tourist and recreational resources. Development of the country’s road transport network with the use of modern means and methods of design is important and an urgent problem. Use of GIS technologies and methods of computational intelligence has shown their high efficiency and expediency of application in solving problems of designing road networks.
The study is devoted to the important scientific and technical task of tracing the main direction and competitive options for the route of traffic flow of the road network, taking into account the characteristics of the terrain and the limitations expressed in the form of source geoinformation data.
Geospatial models based on publicly available data have been developed. This will allow design organisations to save significantly at the stage of preliminary research on the passage of the optimal and competitive options for the route. The sources of spatial information, their characteristics and methods of formation into a form suitable for the functioning of the ant method are revealed.
The Max–Min method of geoinformation multiagent optimisation has been modified. As a result, it is possible to increase the efficiency of planning the necessary time, computing resources and parameter settings to obtain the optimal result.
Experimental researches have been carried out in different natural conditions of Chernivtsi region. Special conditions have been established for hard-to-reach areas (mountainous terrain, high forest cover, significant density of the river network, etc.). Thus, the possibility of using the specified modified method for similar conditions is proved.
The recommended directions of further modification of geoinformation multiagent optimisation of planning of development of a road transport network, directed on automation of labour-consuming operations and increase of efficiency, are offered.